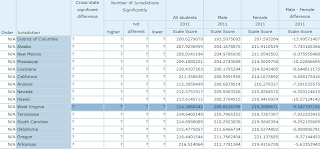
This assignment was actually interesting to view, but I had a series of frustrating events happen during this assignment; my computer decided to crash during this event causing me to redo all the work on the library computer, and since I cannot download any applications, I was refrained to using Paint instead of Jing when posting where the states our within our graph. Other then my mistrials within my day, this assignment was easy to follow due to the videos provided and since I have lived in both WV and MD, it was fun to look at the differences.
Descriptive Statistics:
When comparing the states, I noticed that West Virginia was very low within the reading level of the 4th grade students of all the states, it was located to be the 41st state, and Maryland was extremely high rannked at third, right behind Massachusetts and New Jersey. With the ranking being listed West Virginia is below average and Maryland is above average.
Scatter Plot Graph- Again, I used paint to locate both West Virignia and Maryland on my graph due to my difficulties with my computer. The graph is able to give you a visual representation of where both states are at within the reading content compared to every state in our country.
Standards:
1a: assist teachers in the ongoing development of knowledge, skills, and understanding of technology systems, resources, and services that are aligned with district and state technology plans.
2 a: consult with teachers as they design methods and strategies for teaching computer/technology concepts and skills within the context of classroom learning.
5a:
model advanced features of word processing, desktop publishing, graphics programs, and utilities to develop professional products.


No comments:
Post a Comment